End-to-End Monitoring Explained for Homelabs: Prometheus, Grafana & Alertmanager
When you’re running a homelab with dozens of containers and services, things will eventually break. The question isn’t if something will fail, but when - and whether you’ll know about it before your users do.
This post walks through building a production-grade monitoring stack using Prometheus + Grafana that monitors 37 containers across 2 hosts, with automatic email alerting and comprehensive dashboards. You’ll get visibility into CPU, memory, disk, network, container metrics, and even ZFS storage - all with 30 days of historical data.
Full Configuration Available: All Docker Compose files, Prometheus configs, alert rules, and Grafana datasources from this guide are available on GitHub. Clone and customize for your homelab.
Contents:
- Why Monitor Your Homelab?
- The Stack Overview
- Architecture
- Docker Compose Setup
- Prometheus Configuration
- Node Exporter for Host Metrics
- cAdvisor for Container Metrics
- Grafana Setup & Data Source
- Building Dashboards
- Alert Rules
- Alertmanager & Notifications
- Tips & Lessons Learned
- What’s Next?
A proper monitoring stack gives you three critical capabilities:
- Visibility: Know what’s happening right now across all your services
- Alerting: Get notified when things go wrong, before they become critical
- Debugging: Historical data to troubleshoot issues and understand trends
I chose the classic observability stack that’s proven itself in production environments:
- Node Exporter: Exposes system-level metrics (CPU, memory, disk, network)
- cAdvisor: Collects container resource usage and performance metrics
- Prometheus: Time-series database that scrapes and stores metrics
- Grafana: Visualization platform for creating dashboards
- Alertmanager: Handles alert routing and notifications
Why this stack? It’s open-source, widely adopted, handles homelab scale easily, and doesn’t require expensive licensing.
%%{init: {'theme': 'base', 'themeVariables': { 'primaryTextColor': '#000', 'nodeTextColor': '#000', 'textColor': '#000', 'nodeBorder': '#333', 'mainBkg': '#fff'}}}%%
flowchart TD

    NE["1.Node Exporter
Host Metrics"]
    CA["2.cAdvisor"]
    PR["3.Prometheus"]
    AM["5.Alertmanager"]
    GR["4.Grafana"]

    PR -->|/metrics| NE & CA
    PR -->|Alerts| AM
    GR -->|Query PromQL| PR
My homelab runs on Proxmox - a bare-metal hypervisor that lets me run multiple isolated workloads on the same hardware without the overhead of full VMs. I use LXC containers as lightweight virtual environments, and run Docker inside the LXC containers.
The monitoring stack (Prometheus, Grafana, Alertmanager, cAdvisor) runs in Docker containers inside an LXC. Node Exporter runs natively on each Proxmox host (outside the LXC) because running it inside Docker-in-LXC reports incorrect memory metrics due to nested containerization.
My setup monitors two hosts:
- Raspberry Pi 5 (192.168.1.201): Running the monitoring stack itself
- N305 Server (192.168.1.50): Main server running 29 containers (Immich, Bitwarden, Jellyfin, etc.)
%%{init: {'theme': 'base', 'themeVariables': { 'primaryTextColor': '#000', 'nodeTextColor': '#000', 'textColor': '#000', 'nodeBorder': '#333', 'mainBkg': '#fff'}}}%%
flowchart TB
    subgraph RPI["Pi5 (192.168.1.201)"]
        subgraph LXC1["LXC"]
            GR["Grafana :3000"]
            PR["Prometheus :9090"]
            AM["Alertmanager :9093"]
            CA1["cAdvisor :8080"]
        end
        NE1["Node Exporter :9100"]
    end

    subgraph N305["N305 (192.168.1.50)"]
        subgraph LXC2["LXC"]
            APPS["26 containers"]
            CA2["cAdvisor :8080"]
        end
        NE2["Node Exporter :9100"]
    end

    PR -->|/metrics| NE1 & CA1 & CA2 & NE2
    PR -->|Alerts| AM
    GR -->|Query PromQL| PR


    %% Styles for clarity
    style RPI fill:#f5f5f5,stroke:#333
    style LXC1 fill:#fff,stroke:#333
    style N305 fill:#f5f5f5,stroke:#333
    style LXC2 fill:#fff,stroke:#333
The monitoring stack runs entirely in Docker on the Raspberry Pi 5. Here’s the complete docker-compose.yml:
networks:
  internal:
    driver: bridge

services:
  prometheus:
    container_name: monitoring-prometheus
    image: prom/prometheus:latest
    hostname: rpi-prometheus
    restart: unless-stopped
    user: "nobody"
    networks:
      - internal
    ports:
      - "9090:9090"
    command:
      - '--config.file=/etc/prometheus/prometheus.yml'
      - '--storage.tsdb.path=/prometheus'
      - '--storage.tsdb.retention.time=30d'
      - '--web.enable-admin-api'
    volumes:
      - /home/ubuntu/docker/prometheus/config:/etc/prometheus
      - /home/ubuntu/docker/prometheus/data:/prometheus
    depends_on:
      - cadvisor
      - alertmanager
    links:
      - cadvisor:cadvisor
      - alertmanager:alertmanager

  grafana:
    container_name: monitoring-grafana
    image: grafana/grafana:latest
    hostname: rpi-grafana
    restart: unless-stopped
    user: "472"
    networks:
      - internal
    ports:
      - "3000:3000"
    volumes:
      - /home/ubuntu/docker/grafana/data:/var/lib/grafana
      - /home/ubuntu/docker/grafana/provisioning:/etc/grafana/provisioning
    depends_on:
      - prometheus

  alertmanager:
    container_name: monitoring-alertmanager
    image: prom/alertmanager:latest
    hostname: rpi-alertmanager
    restart: unless-stopped
    networks:
      - internal
    ports:
      - "9093:9093"
    volumes:
      - /home/ubuntu/docker/alertmanager:/etc/alertmanager
    command:
      - '--config.file=/etc/alertmanager/alertmanager.yml'
      - '--storage.path=/alertmanager'

  cadvisor:
    container_name: monitoring-cadvisor
    image: gcr.io/cadvisor/cadvisor:v0.49.1
    hostname: rpi-cadvisor
    restart: unless-stopped
    privileged: true
    networks:
      - internal
    expose:
      - 8080
    command:
      - '-housekeeping_interval=15s'
      - '-docker_only=true'
      - '-store_container_labels=false'
    devices:
      - /dev/kmsg
    volumes:
      - /:/rootfs:ro
      - /var/run:/var/run:rw
      - /sys:/sys:ro
      - /var/lib/docker/:/var/lib/docker:ro
      - /dev/disk/:/dev/disk:ro
      - /etc/machine-id:/etc/machine-id:ro
Key configuration details:
- 30-day retention: Prometheus keeps 30 days of metrics data
- 15-second housekeeping: cAdvisor updates container metrics every 15 seconds
- Privileged cAdvisor: Required to read container metrics from the host
- Internal network: Services communicate via Docker network, only exposing necessary ports
Prometheus is a time-series database that stores metrics as data points with timestamps. It works by periodically “scraping” (pulling) metrics from configured endpoints over HTTP. Each scrape collects current metric values and stores them with a timestamp, allowing you to query historical trends.
The key concept: Prometheus pulls metrics - it doesn’t wait for services to push data. This means your services need to expose a /metrics endpoint that Prometheus can scrape.
Prometheus needs to know what to scrape. Here’s my prometheus.yml:
global:
  scrape_interval: 15s
  evaluation_interval: 15s

alerting:
  alertmanagers:
    - static_configs:
        - targets:
          - alertmanager:9093

rule_files:
    - "alerts/*.yml"

scrape_configs:
  # Prometheus itself
  - job_name: 'prometheus'
    scrape_interval: 5s
    static_configs:
      - targets: ['localhost:9090']

  # Raspberry Pi 5 - Node Exporter
  - job_name: 'monitoring-host-node'
    scrape_interval: 15s
    static_configs:
      - targets: ['192.168.1.201:9100']
        labels:
          host: 'monitoring-host'
          instance_name: 'rpi-monitoring'

  # Raspberry Pi 5 - cAdvisor
  - job_name: 'monitoring-host-cadvisor'
    scrape_interval: 15s
    static_configs:
      - targets: ['cadvisor:8080']
        labels:
          host: 'monitoring-host'
          instance_name: 'rpi-monitoring'

  # N305 - Node Exporter
  - job_name: 'n305-node'
    scrape_interval: 15s
    static_configs:
      - targets: ['192.168.1.50:9100']
        labels:
          host: 'n305'
          instance_name: 'n305-server'

  # N305 - cAdvisor
  - job_name: 'n305-cadvisor'
    scrape_interval: 15s
    static_configs:
      - targets: ['192.168.1.50:8080']
        labels:
          host: 'n305'
          instance_name: 'n305-server'
Important notes:
- Jobs: A “job” groups related scrape targets together (e.g.,
monitoring-host-node,n305-cadvisor). Prometheus automatically adds ajoblabel to every metric, so you can filter by job in queries. I use separate jobs for Node Exporter vs cAdvisor metrics. - Custom labels: Each target gets
hostandinstance_namelabels for easier filtering - 15-second scrapes: Balance between data granularity and resource usage
- Alert rules: Loaded from separate files in
alerts/directory
Node Exporter is a Prometheus exporter that exposes hardware and OS-level metrics from Linux systems. It runs as a service on each host and provides a /metrics HTTP endpoint that Prometheus can scrape.
Think of it as a bridge between your system’s kernel statistics (CPU, memory, disk, network) and Prometheus. It reads data from /proc, /sys, and other system sources, then formats it into Prometheus-compatible metrics.
Node Exporter runs natively (not in Docker) on both hosts to collect system-level metrics.
# Install Node Exporter
wget https://github.com/prometheus/node_exporter/releases/download/v1.7.0/node_exporter-1.7.0.linux-amd64.tar.gz
tar xvfz node_exporter-1.7.0.linux-amd64.tar.gz
sudo cp node_exporter-1.7.0.linux-amd64/node_exporter /usr/local/bin/
Create /etc/systemd/system/node_exporter.service:
[Unit]
Description=Node Exporter
After=network.target

[Service]
Type=simple
User=node_exporter
ExecStart=/usr/local/bin/node_exporter

[Install]
WantedBy=multi-user.target
sudo useradd -rs /bin/false node_exporter
sudo systemctl daemon-reload
sudo systemctl enable node_exporter
sudo systemctl start node_exporter
Why native instead of Docker? I initially ran Node Exporter in Docker within LXC containers, but it reported incorrect memory usage (0.1% instead of actual 40%). Running it natively on the host gives accurate metrics.
Node Exporter exposes hundreds of metrics at :9100/metrics, including:
- CPU usage per core and mode (user, system, idle, iowait)
- Memory (total, available, cached, buffers, swap)
- Disk usage and I/O statistics
- Network interface traffic and errors
- Load averages
- Filesystem usage (including ZFS pools!)
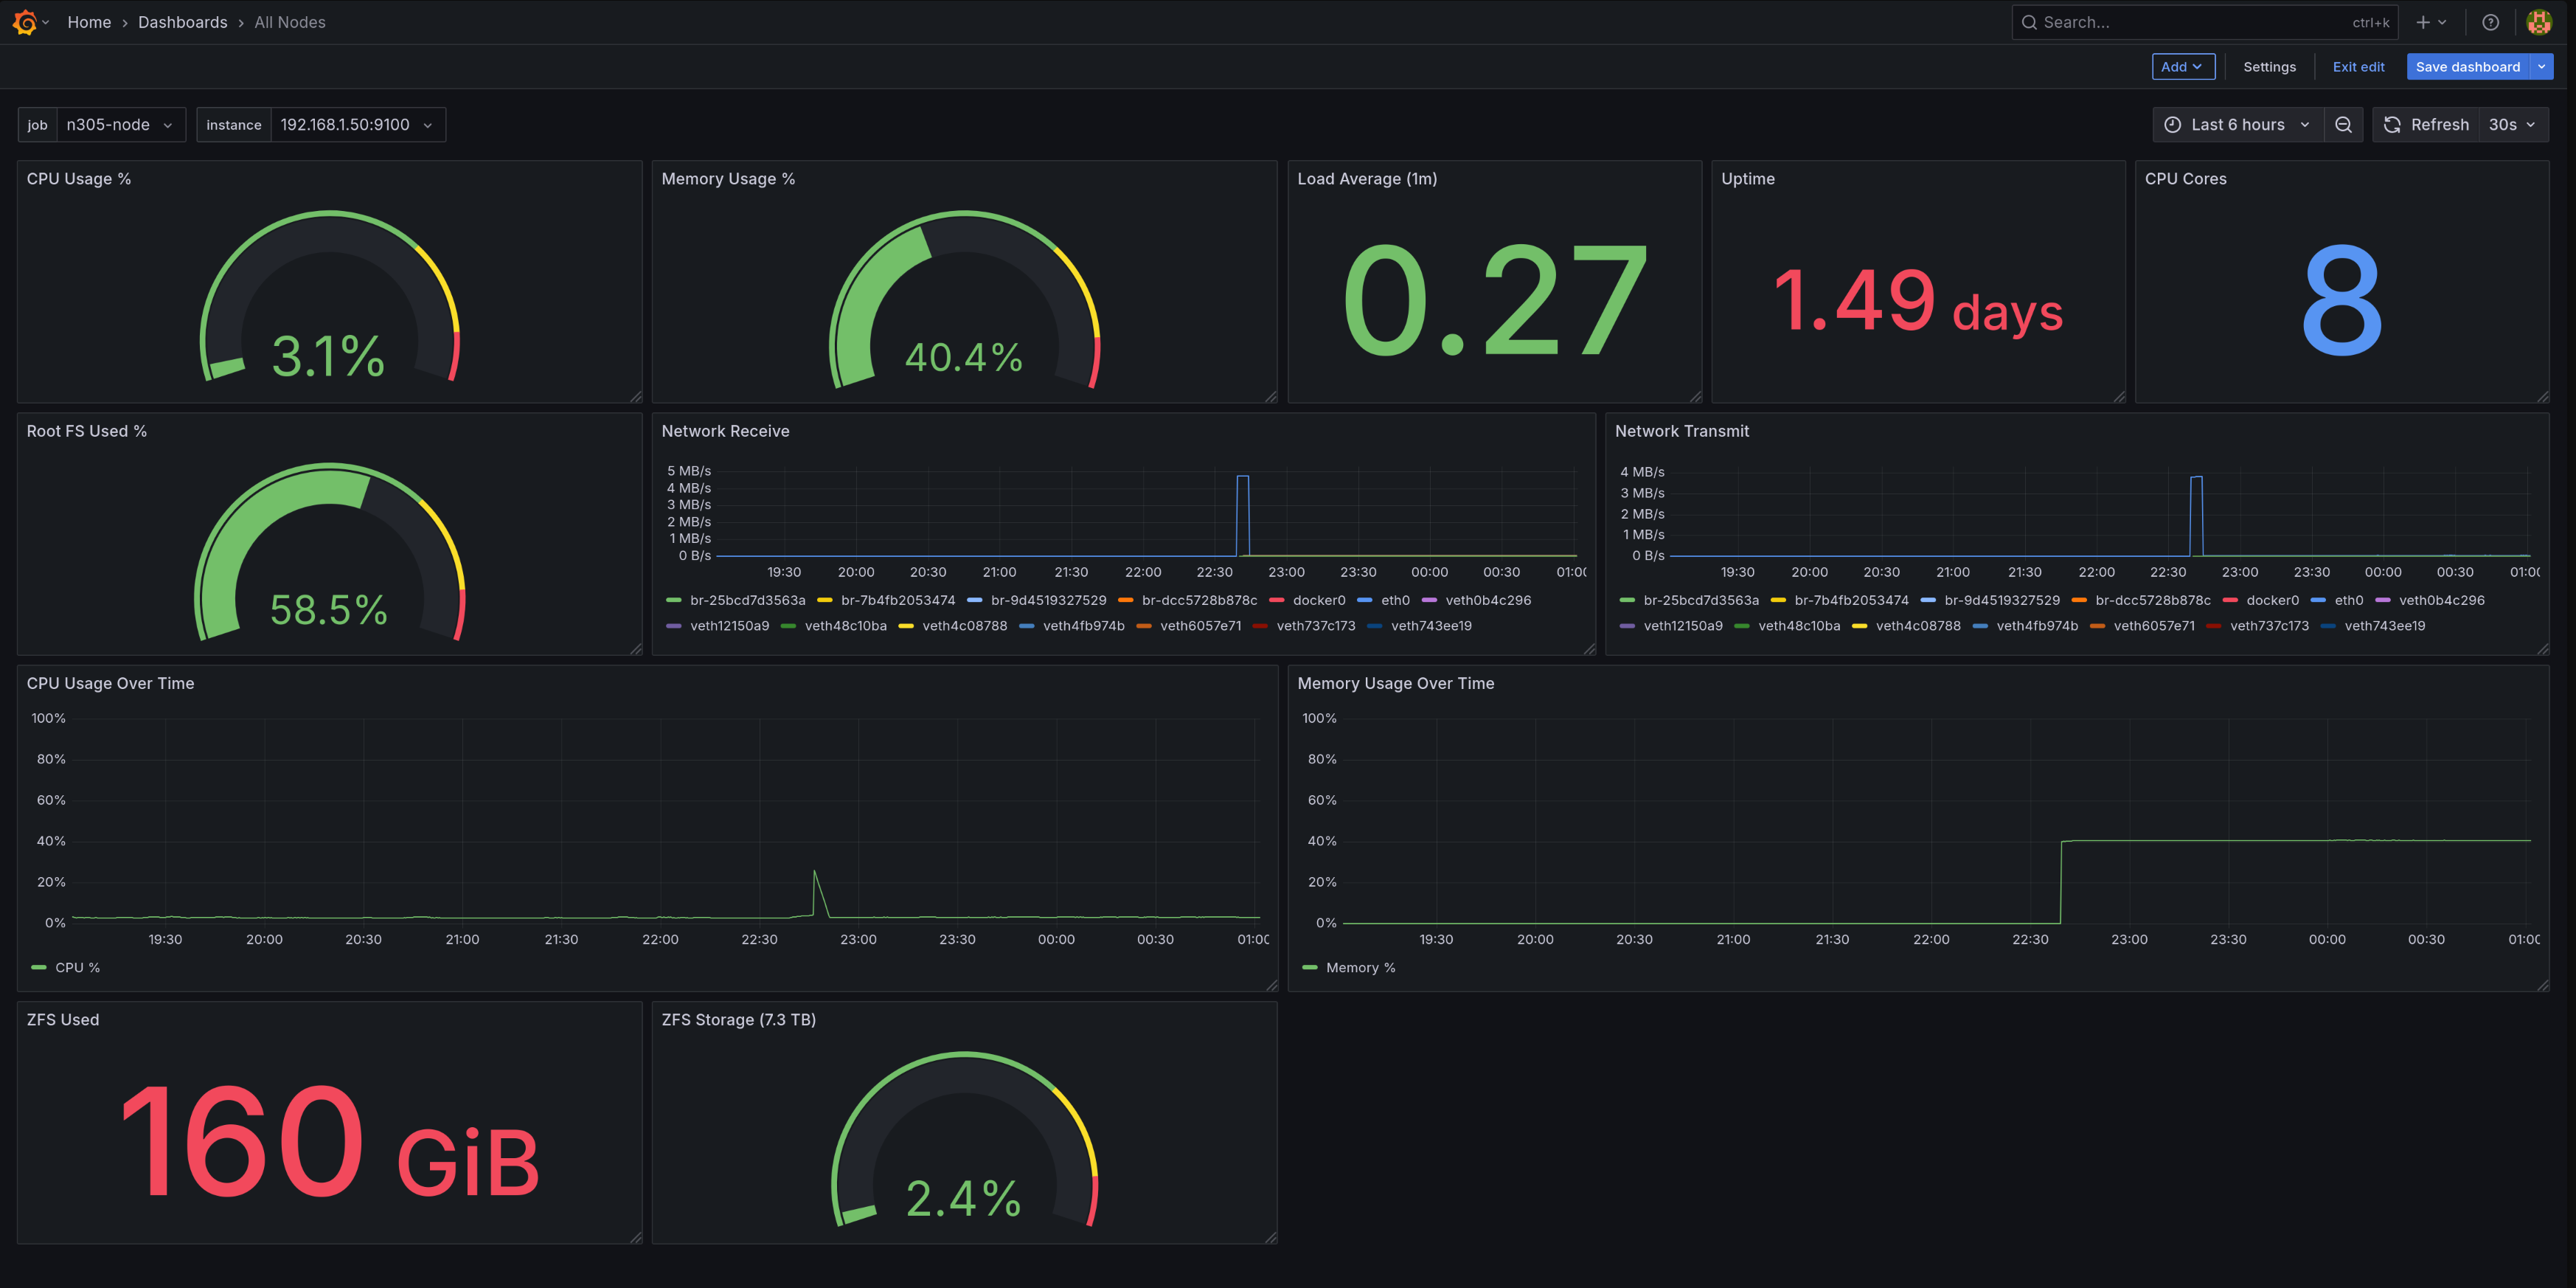 The “All Nodes” dashboard displaying N305 system metrics
cAdvisor (Container Advisor) is Google’s open-source container monitoring tool. It automatically discovers all containers on a host and collects resource usage metrics: CPU, memory, network, and disk I/O per container.
Unlike Node Exporter which monitors the host system, cAdvisor specifically monitors containerized applications. It understands Docker’s resource limits (enforced via Linux cgroups - the kernel feature that isolates container resources) and can show both usage and limits for each container.
cAdvisor runs in Docker and monitors all other containers on the same host.
The key configuration flags:
command:
  - '-housekeeping_interval=15s'  # Update metrics every 15s
  - '-docker_only=true'            # Only monitor Docker containers
  - '-store_container_labels=false' # Don't store all labels (reduces cardinality)
Why privileged mode? cAdvisor needs access to the host’s cgroups (Linux kernel’s resource isolation mechanism) to read container resource usage:
privileged: true
devices:
  - /dev/kmsg
volumes:
  - /:/rootfs:ro
  - /var/run:/var/run:rw
  - /sys:/sys:ro
  - /var/lib/docker/:/var/lib/docker:ro
cAdvisor provides metrics like:
- Container CPU usage (total and per-core)
- Container memory usage and limits
- Network I/O per container
- Disk I/O per container
- Container restart counts
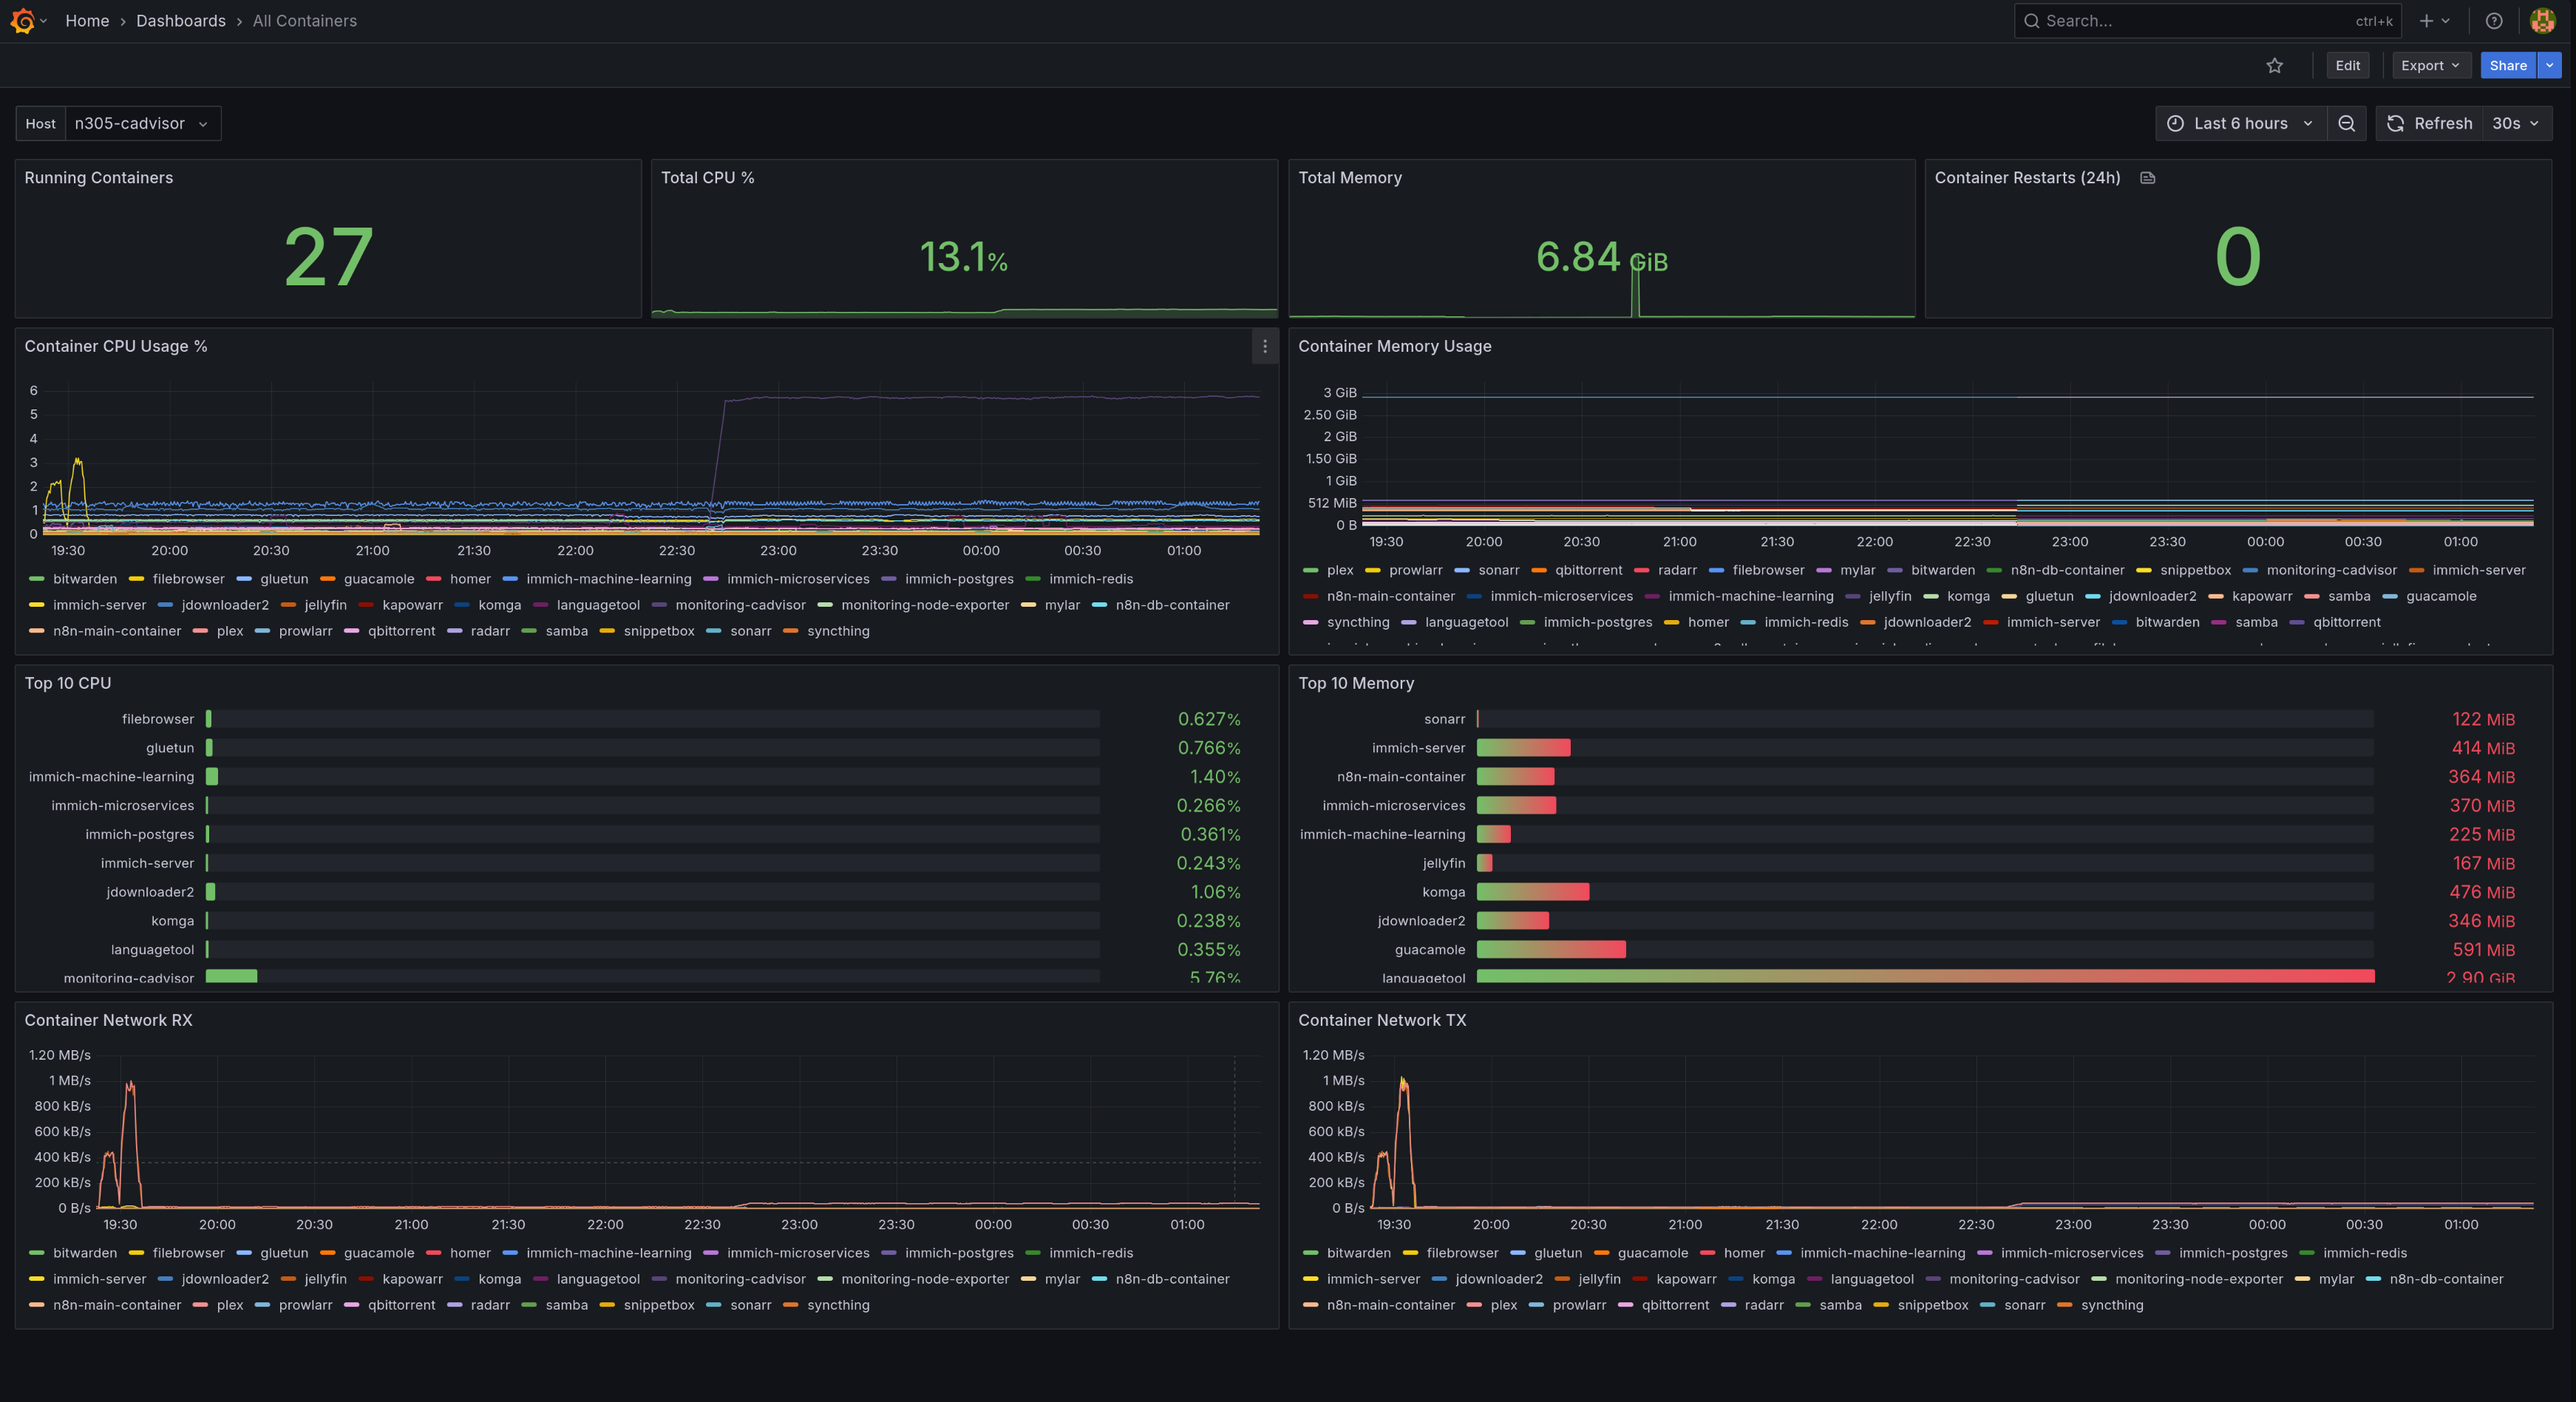
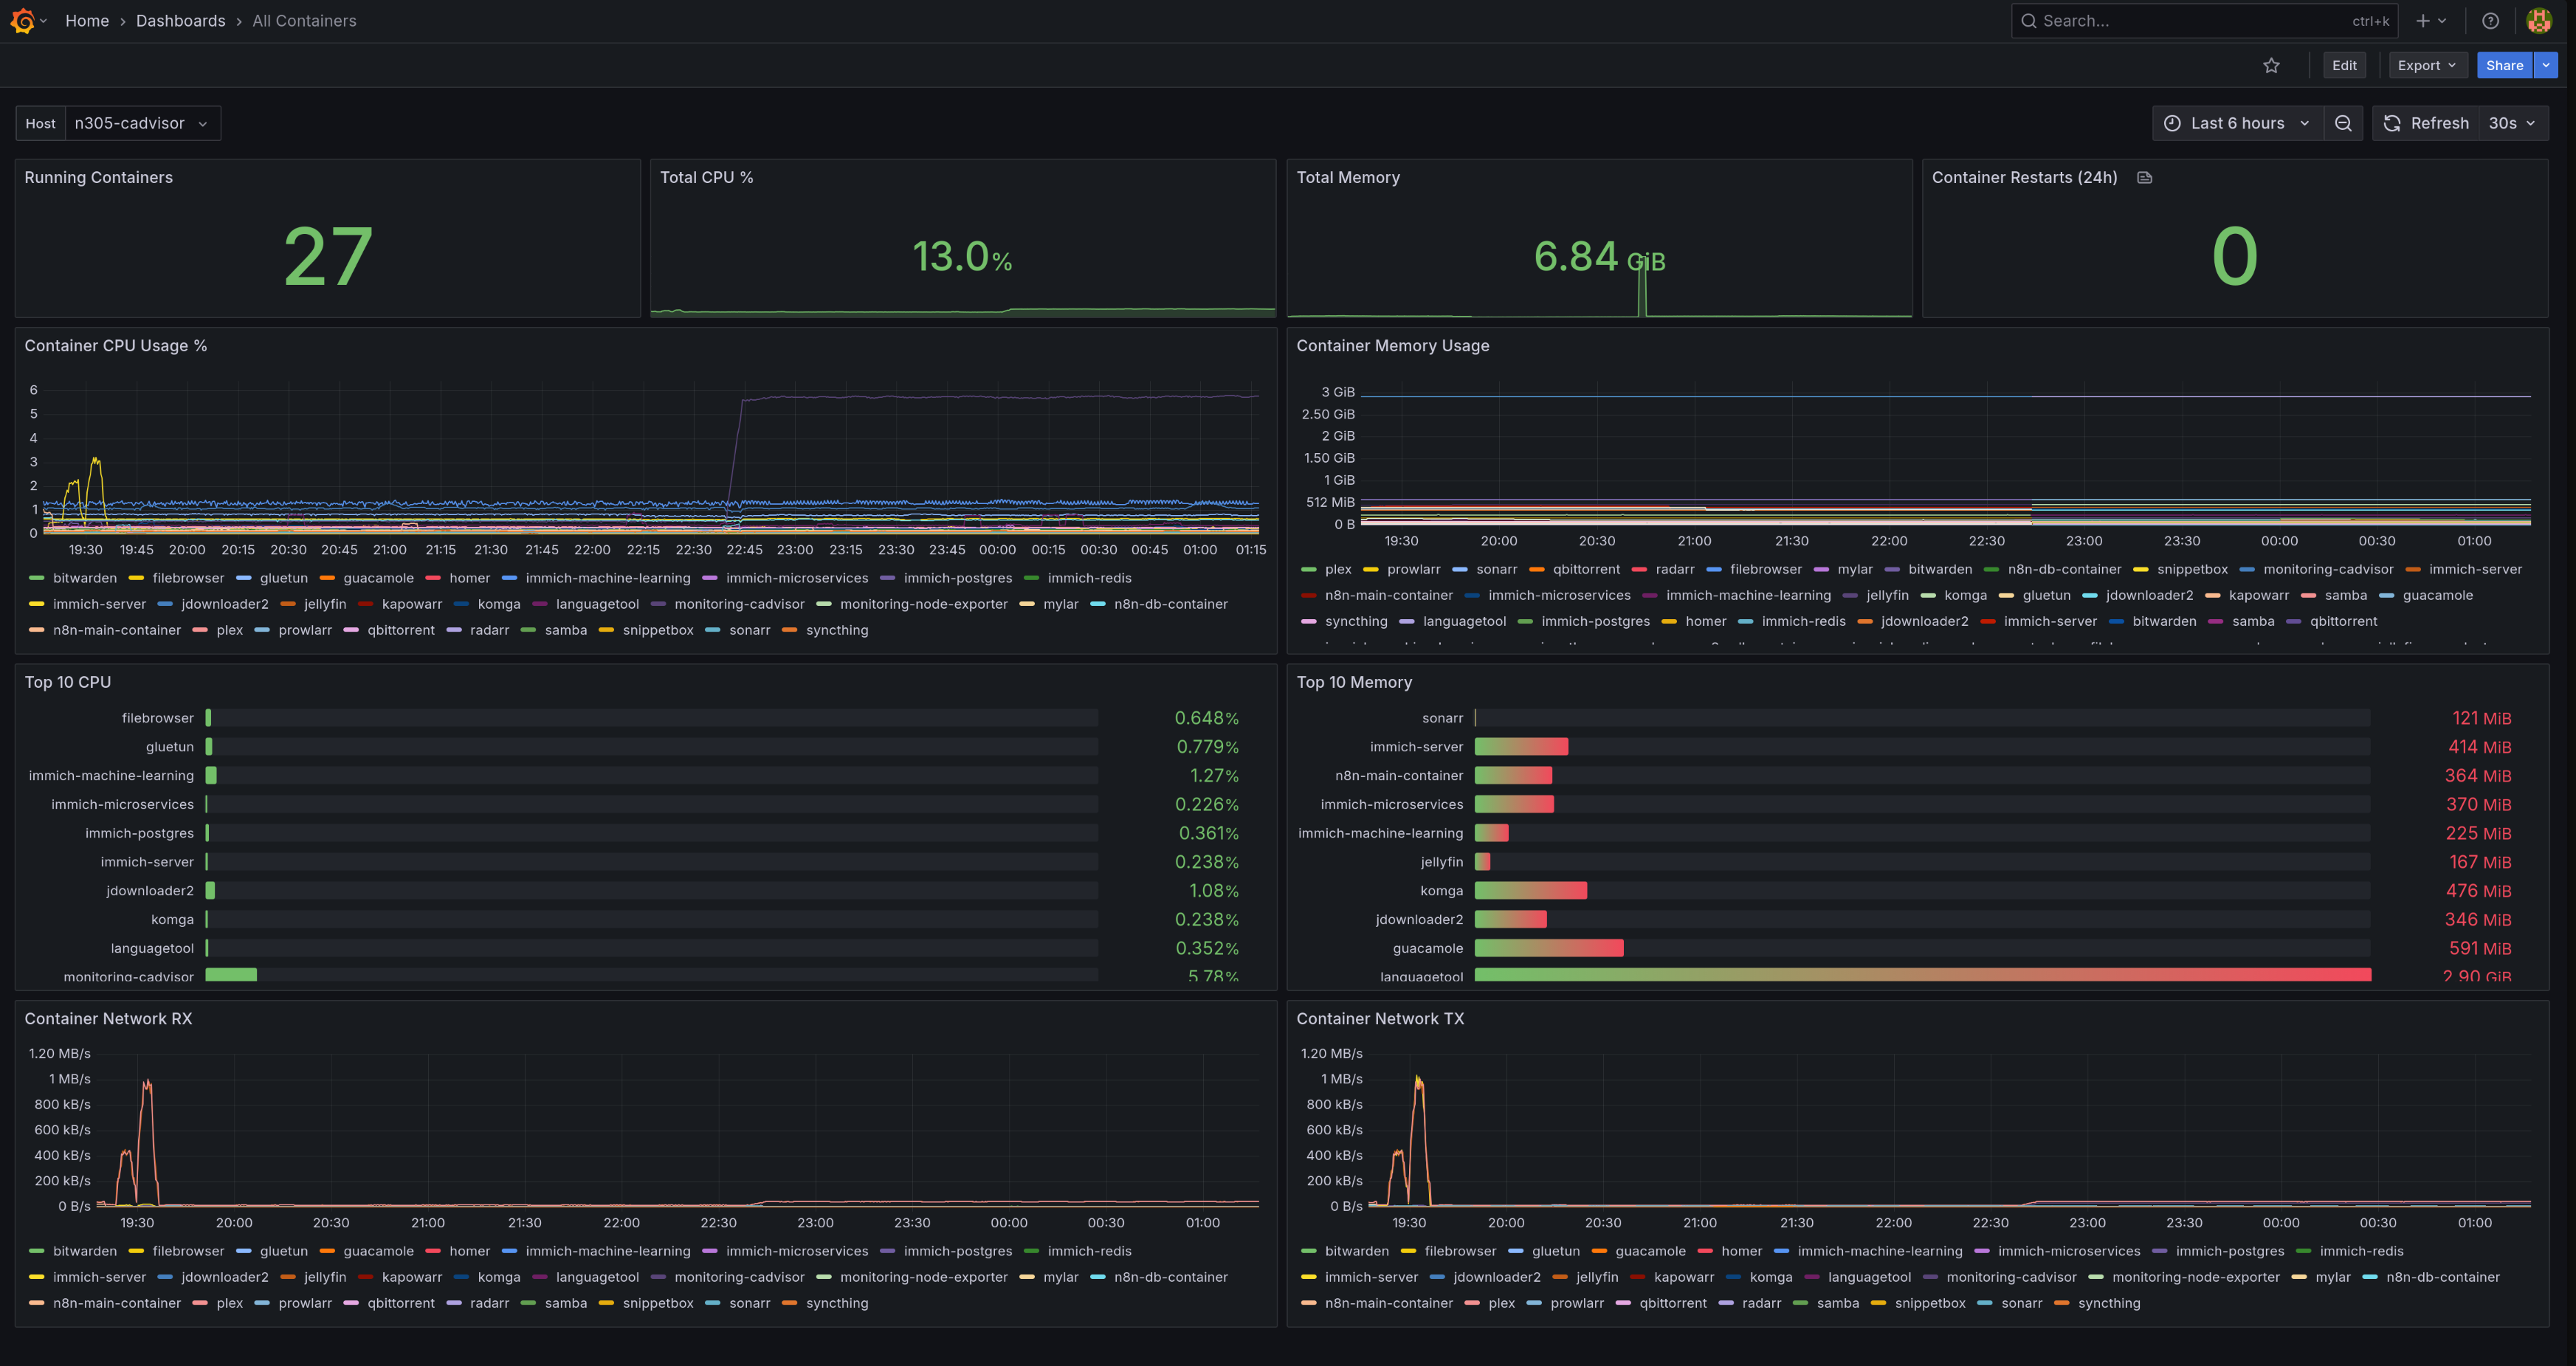 cAdvisor dashboard displaying container metrics across all monitored hosts
Grafana is the visualization tool that turns Prometheus metrics into beautiful dashboards and graphs. While Prometheus stores the raw time-series data, Grafana connects to it as a “data source” and uses PromQL (Prometheus Query Language) to query and visualize metrics. You could query Prometheus directly, but Grafana makes it visual and user-friendly.
After starting Grafana, log in at http://192.168.1.201:3000 (default credentials: admin/admin).
Instead of manually adding the data source, provision it automatically with a YAML file in /home/ubuntu/docker/grafana/provisioning/datasources/prometheus.yml:
apiVersion: 1

datasources:
  - name: Prometheus
    type: prometheus
    access: proxy
    url: http://prometheus:9090
    isDefault: true
    editable: false
    uid: PBFA97CFB590B2093
Important: The uid must match what you use in dashboard JSON files. I learned this the hard way when my dashboards showed “N/A” everywhere because they had a hardcoded UID that didn’t match my actual Prometheus datasource!
Dashboards transform raw Prometheus metrics into visual panels you can actually understand at a glance. Instead of querying Prometheus manually with PromQL, you build panels (gauges, graphs, stats) that auto-update and show trends over time.
The “All Nodes” dashboard displaying N305 system metrics
The dashboard has 12 panels showing current status and historical trends:
- Top row: Colored gauges (CPU 31%, Memory 40.4%, Root FS 58.5%) and stat panels (Load 0.27, Uptime 1.49 days, 8 CPU cores)
- Middle section: Network traffic graphs for all interfaces, plus CPU and memory usage time-series
- Bottom row: ZFS storage showing 160 GiB used out of 2.3 TB (2.4% full)
You can build this manually by clicking “Add Panel” in Grafana, or export/import dashboard JSON files for faster setup.
Variables make your dashboard reusable across multiple hosts. Instead of hardcoding instance="192.168.1.201:9100" in every query, you use instance="$instance" and select which host to view from a dropdown.
Create these variables in Dashboard settings > Variables:
Job selector (which monitoring job to view):
Name: job
Type: Query
Query: label_values(node_uname_info, job)
Instance selector (which specific host):
Name: instance
Type: Query
Query: label_values(node_uname_info{job="$job"}, instance)
Now you can switch between Raspberry Pi 5 and N305 using dropdowns at the top of the dashboard.
Here are the queries powering each panel type. PromQL is Prometheus’s query language - it looks intimidating at first, but once you understand a few patterns, it’s straightforward.
Gauge Panels (current value with color thresholds):
# CPU Usage (%)
100 - (avg(rate(node_cpu_seconds_total{mode="idle",instance="$instance",job="$job"}[5m])) * 100)
This calculates CPU usage by measuring how much time the CPU is not idle over a 5-minute window. The rate() function converts cumulative counters into per-second rates.
# Memory Usage (%)
100 * (1 - ((node_memory_MemAvailable_bytes{instance="$instance",job="$job"}) / node_memory_MemTotal_bytes{instance="$instance",job="$job"}))
Uses MemAvailable instead of MemFree because Linux caches unused memory. MemAvailable accounts for reclaimable cache, giving you the real available memory.
# Root Disk Usage (%)
100 - ((node_filesystem_avail_bytes{instance="$instance",job="$job",mountpoint="/"} / node_filesystem_size_bytes{instance="$instance",job="$job",mountpoint="/"}) * 100)

# ZFS Storage (%)
(1 - (node_filesystem_avail_bytes{instance="$instance",job="$job",fstype="zfs",mountpoint="/storage/media"} / node_filesystem_size_bytes{instance="$instance",job="$job",fstype="zfs",mountpoint="/storage/media"})) * 100
Stat Panels (single number display):
# Load Average (1 minute)
node_load1{instance="$instance",job="$job"}

# System Uptime (seconds)
node_time_seconds{instance="$instance",job="$job"} - node_boot_time_seconds{instance="$instance",job="$job"}

# CPU Core Count
count(count(node_cpu_seconds_total{instance="$instance",job="$job"}) by (cpu))
Time-Series Graphs (trends over time):
# CPU Usage History
100 - (avg(rate(node_cpu_seconds_total{mode="idle",instance="$instance",job="$job"}[5m])) * 100)

# Memory Usage History
100 * (1 - ((node_memory_MemAvailable_bytes{instance="$instance",job="$job"}) / node_memory_MemTotal_bytes{instance="$instance",job="$job"}))

# Network Receive Rate (per device)
rate(node_network_receive_bytes_total{instance="$instance",job="$job",device!="lo"}[5m])

# Network Transmit Rate (per device)
rate(node_network_transmit_bytes_total{instance="$instance",job="$job",device!="lo"}[5m])
The device!="lo" filter excludes the loopback interface since you only care about physical network traffic.
Prometheus continuously evaluates alert rules defined in YAML files. When a condition is met for the specified duration (for: 5m), Prometheus fires the alert and sends it to Alertmanager for routing and notification.
Alert rules are defined in separate YAML files loaded by Prometheus.
/home/ubuntu/docker/prometheus/config/alerts/system-alerts.yml:
groups:
  - name: system-alerts
    rules:
      # Disk space critical (<10% free)
      - alert: DiskSpaceLow
        expr: (node_filesystem_avail_bytes{fstype=~"ext4|xfs"} / node_filesystem_size_bytes{fstype=~"ext4|xfs"}) * 100 < 10
        for: 5m
        labels:
          severity: critical
        annotations:
          summary: "Disk space low on {{ $labels.instance }}"
          description: "Disk {{ $labels.mountpoint }} on {{ $labels.instance }} has less than 10% free space ({{ $value | printf \"%.1f\" }}% free)"

      # High memory usage (>90%)
      - alert: HighMemoryUsage
        expr: (1 - (node_memory_MemAvailable_bytes / node_memory_MemTotal_bytes)) * 100 > 90
        for: 5m
        labels:
          severity: warning
        annotations:
          summary: "High memory usage on {{ $labels.instance }}"
          description: "Memory usage on {{ $labels.instance }} is above 90% (current: {{ $value | printf \"%.1f\" }}%)"

      # High CPU usage (>90% for 10 minutes)
      - alert: HighCPUUsage
        expr: 100 - (avg by(instance) (rate(node_cpu_seconds_total{mode="idle"}[5m])) * 100) > 90
        for: 10m
        labels:
          severity: warning
        annotations:
          summary: "High CPU usage on {{ $labels.instance }}"
          description: "CPU usage on {{ $labels.instance }} is above 90% for 10 minutes (current: {{ $value | printf \"%.1f\" }}%)"

      # Host down
      - alert: HostDown
        expr: up{job=~".*node.*"} == 0
        for: 2m
        labels:
          severity: critical
        annotations:
          summary: "Host {{ $labels.instance }} is down"
          description: "Node exporter on {{ $labels.instance }} has been unreachable for more than 2 minutes"
/home/ubuntu/docker/prometheus/config/alerts/container-alerts.yml:
groups:
  - name: container-alerts
    rules:
      # Container down
      - alert: ContainerDown
        expr: absent(container_last_seen{name=~".+"}) == 1
        for: 2m
        labels:
          severity: critical
        annotations:
          summary: "Container {{ $labels.name }} is down"
          description: "Container {{ $labels.name }} on {{ $labels.host }} has been down for more than 2 minutes"

      # Container high memory (>8GB)
      - alert: ContainerHighMemory
        expr: container_memory_usage_bytes{name=~".+"} > 8589934592
        for: 5m
        labels:
          severity: warning
        annotations:
          summary: "Container {{ $labels.name }} high memory"
          description: "Container {{ $labels.name }} on {{ $labels.host }} memory usage is above 8GB (current: {{ $value | humanize1024 }})"

      # Critical service down (Bitwarden, Immich)
      - alert: CriticalServiceDown
        expr: absent(container_last_seen{name=~"bitwarden|immich-server"})
        for: 1m
        labels:
          severity: critical
        annotations:
          summary: "Critical service {{ $labels.name }} is down"
          description: "Critical service {{ $labels.name }} has been down for more than 1 minute - immediate attention required"
Alertmanager receives alerts from Prometheus and handles routing, grouping, deduplication, and notification delivery. It allows complex routing logic - for example, sending critical alerts via SMS and warnings via email, without cluttering your Prometheus alert definitions.
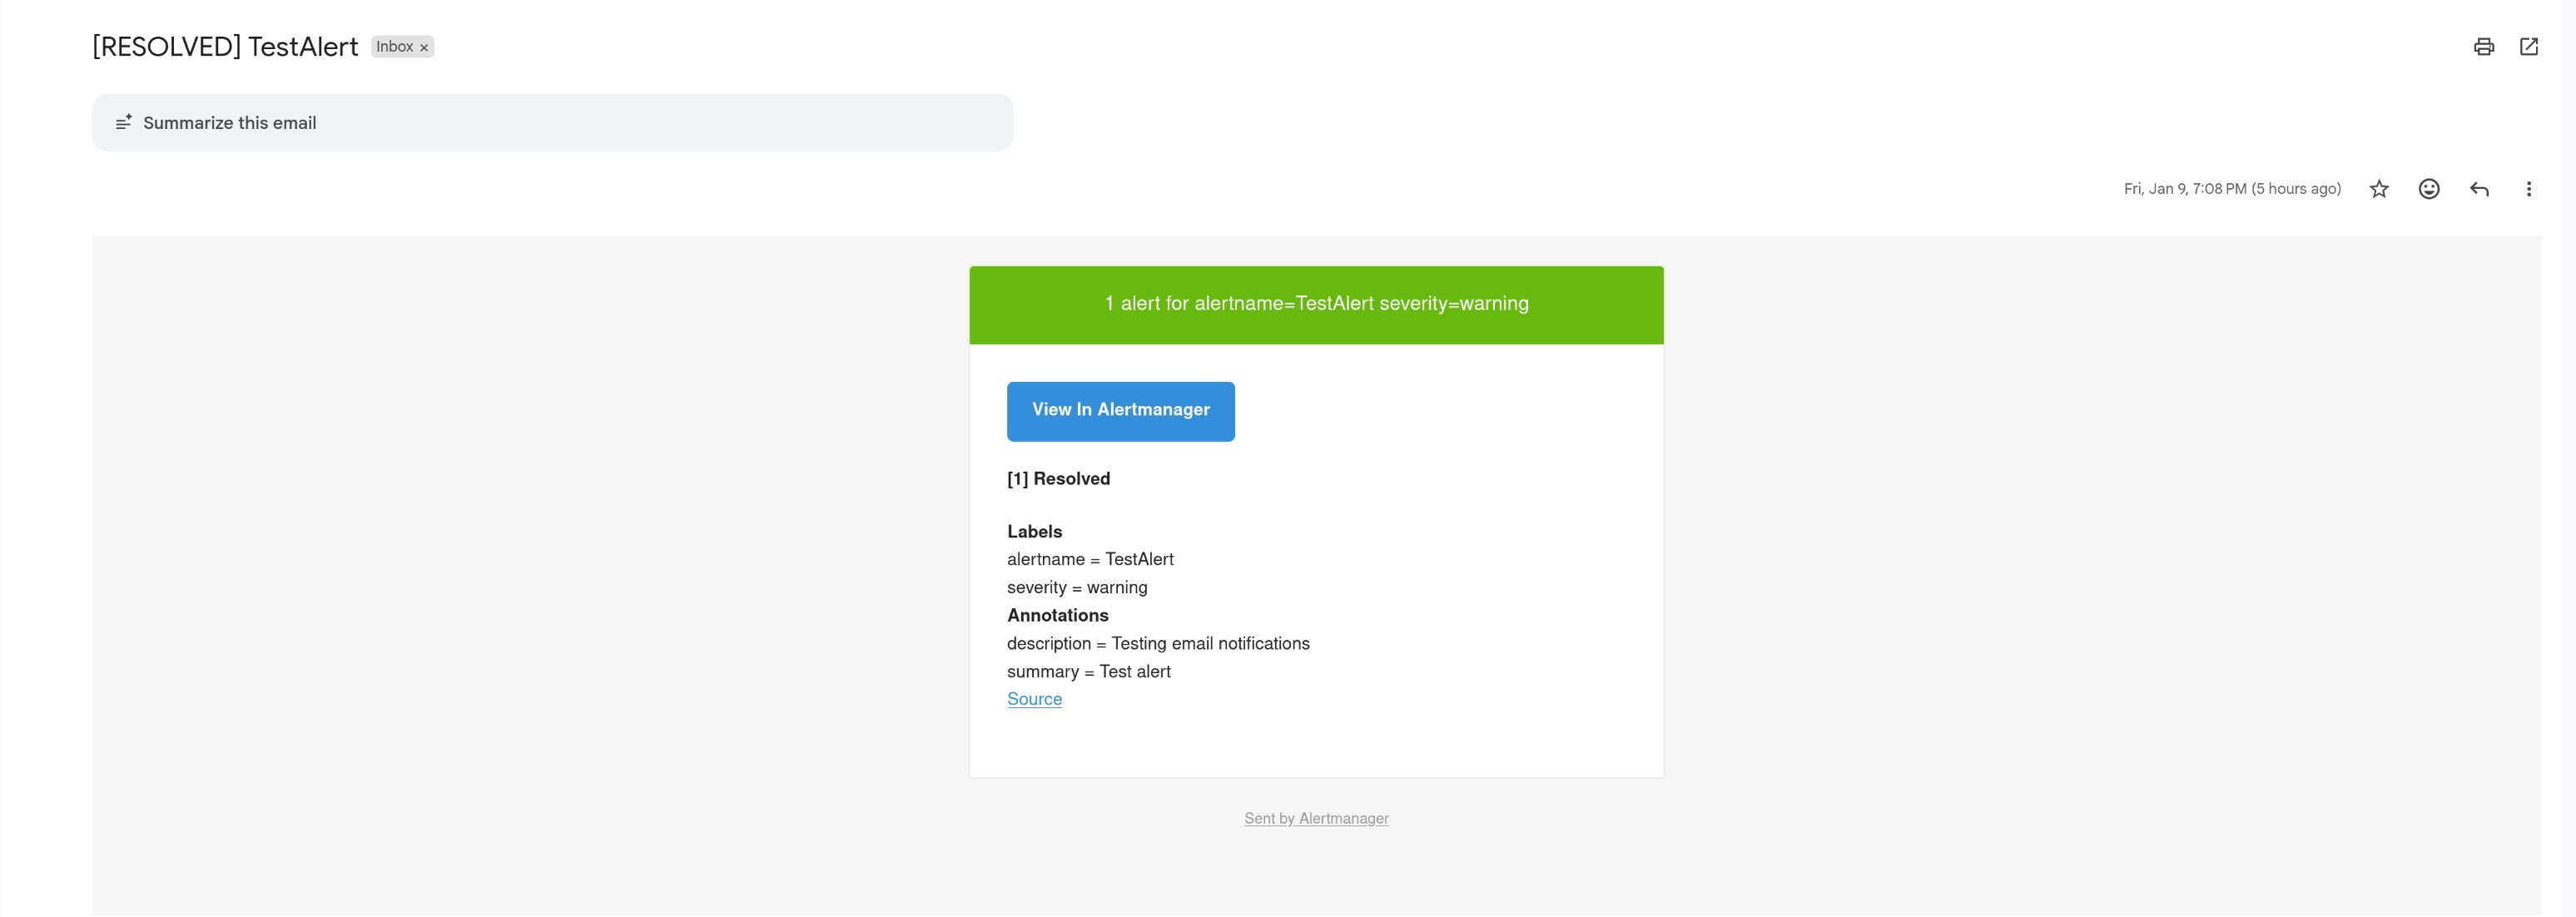 Email notification showing alert details with severity level, affected instance, and resolution instructions
Before configuring Alertmanager, you need a Gmail App Password. This takes less than 2 minutes:
- Go to https://myaccount.google.com/apppasswords
- Sign in to your Google account
- Enter “Alertmanager” as the app name
- Click “Create”
- Copy the 16-character password (you’ll need it for the config below)
Configuration file: /home/ubuntu/docker/alertmanager/alertmanager.yml
global:
  resolve_timeout: 5m
  smtp_smarthost: smtp.gmail.com:587
  smtp_from: your-email@gmail.com
  smtp_auth_username: your-email@gmail.com
  smtp_auth_password: "your-app-password"  # Use App Password from step 5, not your regular Gmail password. More secure and works with 2FA.
  smtp_require_tls: true

route:
  group_by: [alertname, severity]
  group_wait: 30s
  group_interval: 5m
  repeat_interval: 4h
  receiver: email
  routes:
    - match:
        severity: critical
      receiver: email-critical
      repeat_interval: 1h

receivers:
  - name: email
    email_configs:
      - to: your-email@gmail.com
        send_resolved: true
        headers:
          subject: "[{{ .Status | toUpper }}] {{ .GroupLabels.alertname }}"

  - name: email-critical
    email_configs:
      - to: your-email@gmail.com
        send_resolved: true
        headers:
          subject: "[CRITICAL] {{ .GroupLabels.alertname }}"

# Prevent warning alerts when critical alerts are firing
inhibit_rules:
  - source_match:
      severity: critical
    target_match:
      severity: warning
    equal: [alertname, instance]
Key features:
- Multiple notification channels: Supports email (Gmail, Outlook), Slack, Discord, PagerDuty, webhooks, and more. This guide uses Gmail SMTP.
- Severity-based routing: Critical alerts repeat every hour, warnings every 4 hours
- Alert grouping: Multiple alerts are grouped by name and severity to reduce noise
- Inhibition: Critical alerts suppress related warning alerts
If you’re running Prometheus in an LXC container, run Node Exporter natively on the host, not in Docker. Docker-in-LXC can report incorrect memory metrics because of the layered containerization.
Don’t manually configure Grafana datasources - provision them with YAML files. This makes your setup reproducible and ensures the datasource UID is consistent.
When importing dashboards, make sure the datasource.uid in panel queries matches your actual Prometheus datasource UID. I spent way too long troubleshooting “N/A” values before realizing my dashboard had a hardcoded UID that didn’t exist.
It’s tempting to set aggressive thresholds, but you’ll end up with alert fatigue. Start conservative (90% disk usage, 10-minute CPU sustained) and tighten based on actual incidents.
Add custom labels like host and instance_name to your scrape configs. This makes filtering and debugging much easier in Grafana and alert rules.
This monitoring setup covers infrastructure and container metrics, but there’s room for improvement:
- Blackbox Exporter: Monitor external endpoints (Is Bitwarden responding? Is Immich up?)
- Postgres Exporter: Database metrics for Immich, Plausible, n8n
- Loki + Promtail: Centralized log aggregation for debugging
- ZFS Health Monitoring: Alert on scrub errors and pool degradation
- SSL Certificate Expiry: Get warned before Let’s Encrypt certs expire
- SLI/SLO Tracking: Service Level Indicators (response time, uptime %) and Objectives (target 99.9% uptime over certain period) for production-grade reliability engineering
- Custom Exporters: Build exporters for applications that don’t expose metrics
This monitoring stack gives you complete visibility into your homelab - 37 containers across 2 hosts, all monitored from a single dashboard with automatic email alerts. The setup works whether you’re running on Proxmox, bare metal, or cloud VMs.
The investment is worth it: you’ll catch issues before they escalate, learn production-grade observability skills, and sleep better knowing your homelab is monitored. The initial 4-hour setup pays for itself the first time it alerts you to a disk filling up or a service crashing.
I write weekly about homelabs, monitoring, and DevOps. If you found this helpful, check out my other posts or subscribe on Dev.to for more practical guides like this one.